2

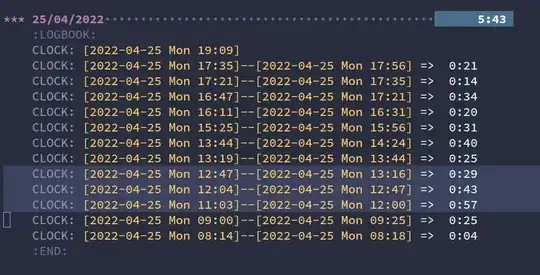
I have been using clocking features of org-mode prefixed as org-clock. As shown by the picture below, it is possible to see the total time under a specific heading after executing org-clock-display.

Source:

*** 25/04/2022
    :LOGBOOK:
    CLOCK: [2022-04-25 Mon 19:09]
    CLOCK: [2022-04-25 Mon 17:35]--[2022-04-25 Mon 17:56] =>  0:21
    CLOCK: [2022-04-25 Mon 17:21]--[2022-04-25 Mon 17:35] =>  0:14
    CLOCK: [2022-04-25 Mon 16:47]--[2022-04-25 Mon 17:21] =>  0:34
    CLOCK: [2022-04-25 Mon 16:11]--[2022-04-25 Mon 16:31] =>  0:20
    CLOCK: [2022-04-25 Mon 15:25]--[2022-04-25 Mon 15:56] =>  0:31
    CLOCK: [2022-04-25 Mon 13:44]--[2022-04-25 Mon 14:24] =>  0:40
    CLOCK: [2022-04-25 Mon 13:19]--[2022-04-25 Mon 13:44] =>  0:25
    CLOCK: [2022-04-25 Mon 12:47]--[2022-04-25 Mon 13:16] =>  0:29
    CLOCK: [2022-04-25 Mon 12:04]--[2022-04-25 Mon 12:47] =>  0:43
    CLOCK: [2022-04-25 Mon 11:03]--[2022-04-25 Mon 12:00] =>  0:57
    CLOCK: [2022-04-25 Mon 09:00]--[2022-04-25 Mon 09:25] =>  0:25
    CLOCK: [2022-04-25 Mon 08:14]--[2022-04-25 Mon 08:18] =>  0:04
    :END:

Image:

enter image description here

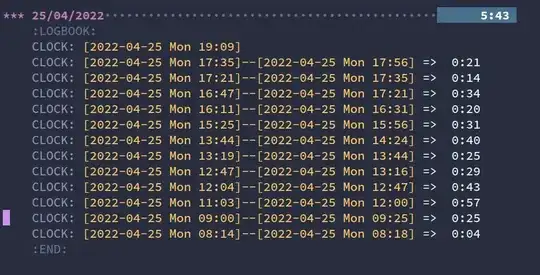
I would like to know it if it is possible to do something similar but just for a specific marked region. For instance, the region below:

enter image description here

After executing some command that I do not know if it already exists, I would see a total of 2:09 since it would have done the sum of 0:26 + 1:00 + 0:43.

Is there a command for this out of the box? Is there a package to provide this? Maybe a short function to add to my in Elisp init file?

Thanks.
Pedro Delfino
  • 1,369
  • 3
  • 13
  • 1
    Please don't use images for the contents of Org mode files: they are plain text, so it's easy to add them here between triple backticks. That would allow interested parties to cut-and-paste the contents of your file for testing. Images are no good for that. I had to create my own file from scratch to test the answer: I'd rather have used your data, but you made it difficult to do that (retyping everything is not much fun...) – NickD Apr 26 '22 at 05:17
  • 1
    I am sorry, @NickD. I thought it would be hard to show the cursor and the marked region with a plain text. And I thought it was not necessary to recreate exactly my situation. Any 2/3 lines of org content would be enough. Any ways, thanks for the help and sorry for the inconvenience! – Pedro Delfino Apr 27 '22 at 14:44
  • 1
    What you did is great: provide the source and then use images to illustrate! – NickD Apr 27 '22 at 16:12

1 Answers1

1

Try the following:

#+begin_src elisp
  (defun ndk/org-clock-sum-current-region (beg end)
     (interactive "r")
     (let ((s (buffer-substring-no-properties beg end)))
       (with-temp-buffer
         (insert "* foo\n")
         (insert s)
         (org-clock-sum)
         (message (format "%d" org-clock-file-total-minutes)))))
#+end_src

org-clock-sum almost does what you want on a region but the interface assumes that there is a headline before the sequence of clock entries, so if you select a region that does not contain a headline, the function returns 0. So we resort to the standard Emacs trick of working in a temp buffer, inserting the stuff we want (in this case, a dummy headline and then the contents of the region) and then we call org-clock-sum on that. org-clock-sum sets a text property on the headline (that's how org-clock-display works: it picks out the text property and adds an overlay with the value of the property) which does us no good in the current scenario; but it also sets the variable org-clock-file-total-minutes, so we print out the value of that variable in the echo area (it's in minutes; converting it to other formats is easy).

NickD
  • 27,023
  • 3
  • 23
  • 42