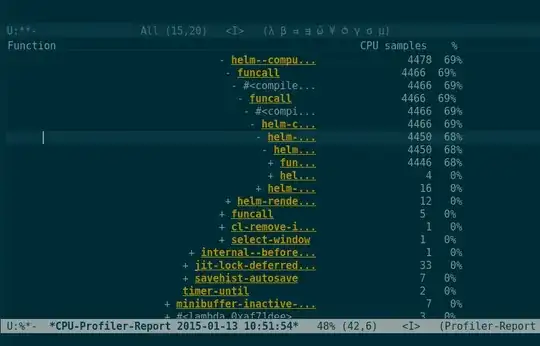
I am debugging a very deep call stack. Unfortunately profiler reports (produced with M-x profiler-report) have a fixed width that obscures critical information when the stack gets deep.

Is there any way I can give myself some extra room?
I am debugging a very deep call stack. Unfortunately profiler reports (produced with M-x profiler-report) have a fixed width that obscures critical information when the stack gets deep.

Is there any way I can give myself some extra room?
setf the caar of profiler-report-cpu-line-format and profiler-report-memory-line-format to a larger width (default 50 and 55). It'll take effect on subsequent runs of profiler-report. (Thanks lawlist's comment for pointing out these variables.)
(setf (caar profiler-report-cpu-line-format) 80
      (caar profiler-report-memory-line-format) 80)